Question:
How can I create an indexed chart?
Solution:
To do so, follow these steps:
1. Create a Database.
2. Insert an XObject to store the device’s information.
3. Insert a Historic.
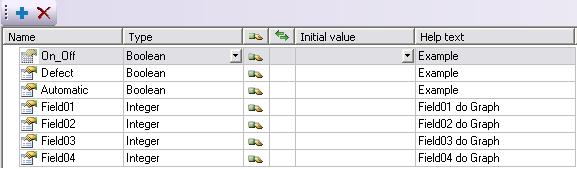
4. In the XObject, configure a number of properties equal to the number of columns to be stored in the Historic, setting up their names and types according to the figure below:
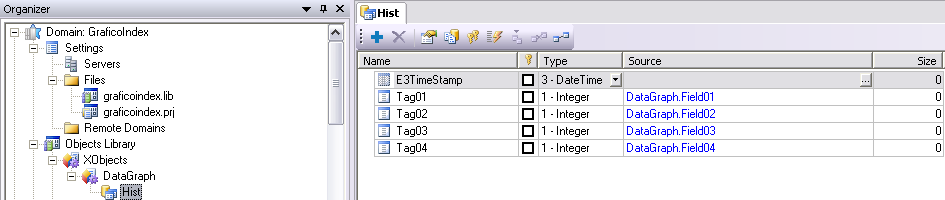
5. In the Historic, create the number of necessary Data Fields, and link their sources to the properties previously created in the XObject.
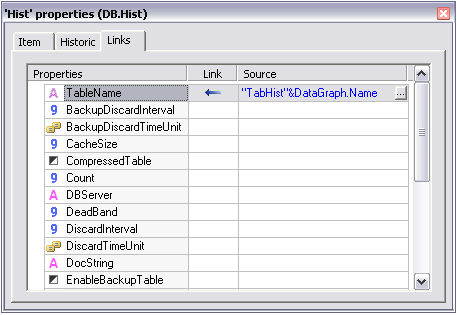
6. Create the following link in the Historic’s TableName property to create a Table: “HistTable”&DataChart.Name.
7. Create an XControl.
8. In the XControl, insert an E3Chart to retrieve information from the previously created XObject, and configure it according to the following steps:
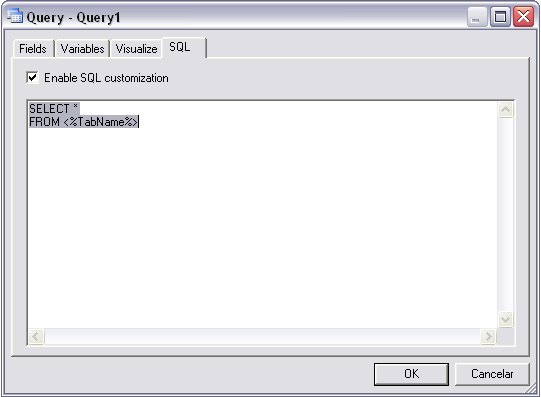
a. In the Query, create the following SQL variable:
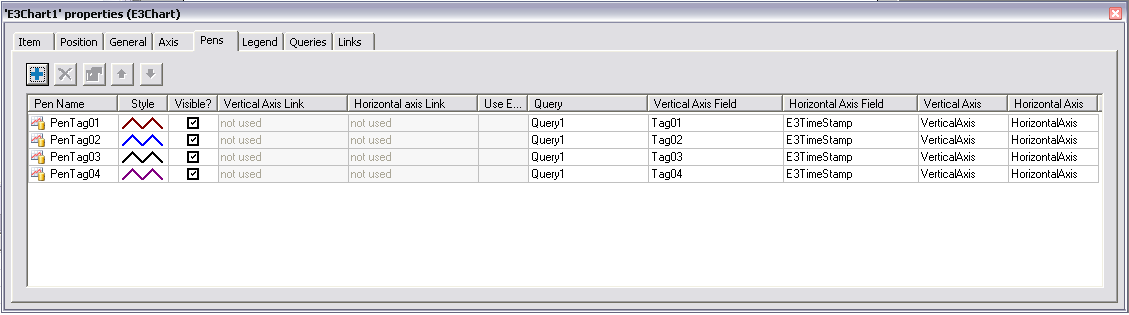
b. On Pens tab, create a number of pens according to the information to be displayed on the E3Chart, and configure its Query, Vertical Axis, and Horizontal Axis properties.
9. Insert the XControl with the E3Chart on a screen.
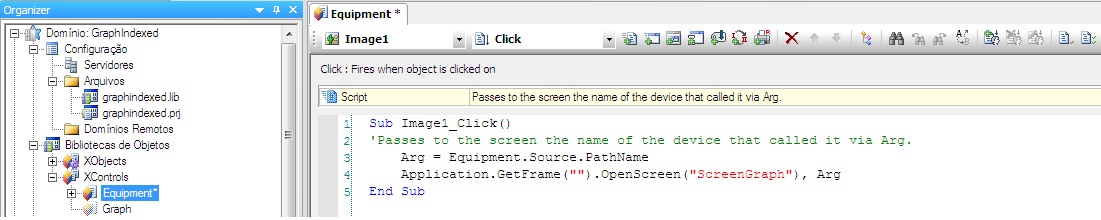
10. In the script of the object that calls the E3Chart’s screen, configure the XObject’s information to be passed to the E3Chart’s Source field.
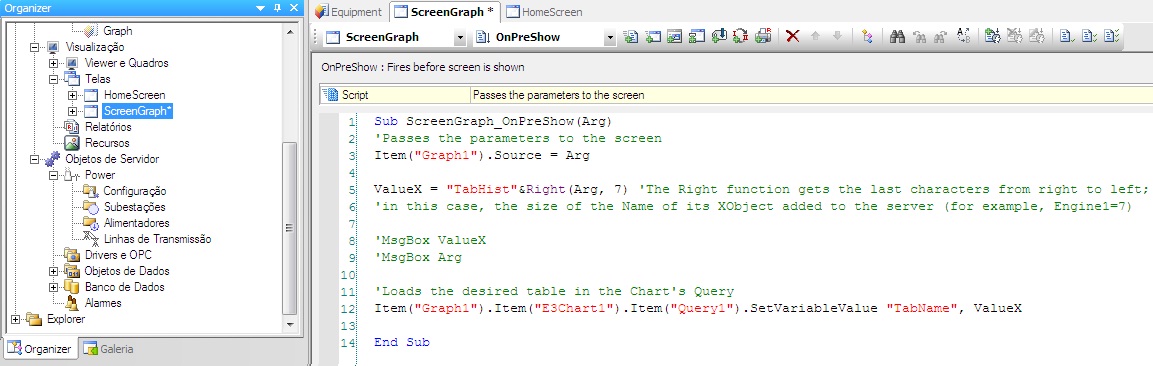
11. Write a script in the screen’s OnPreShow event to handle the information sent by the object that called it.
NOTE: Check the attached demo application developed with Elipse E3 version 3.2 build 260.
Attachments:
