1) Introduction
Monitoring the current status of computers on a network using Elipse E3 is not always a simple task. In order to do so, we developed Elipse SysInfo driver, where you can consult, in real time, a great amount of data from the operational system and from processes being executed in each computer. In addition to the driver, we also created a library to facilitate checking important data on the computer’s performance, with alarms and configurable notes.
2) Elipse SysInfo driver
The Elipse SysInfo driver retrieves data from Performance Monitor, which is a Microsoft Management Console (MMC) snap-in. Information is read via the counters supplied by the operating system, and also by programs being executed in each computer. Therefore, the available counters can vary according to the system and software installed.
There are several counters that are common to most Windows versions, such as counters with information on resources such as processor, memory, and hard disk. Based on this data, a library was created for monitoring and analyzing the computers on a network. For further information, check Elipse SysInfo’s user manual.
3) perfmon.lib library
The perfmon.lib library’s goal is to show the user the computer’s basic information for proper functioning: processor, memory, and hard disk. By default, the monitored components have four different statuses: Fail (communication has failed), Normal, Attention, and Critical.
The value range for each status is configurable via an XControl (CMDMonitorData), whose default values can be seen in the table below. These values were established based on an article published by Microsoft.
|
Counter |
Normal |
Attention |
Critical |
| Memory\Available Mbytes (MB) |
100 ~ 8 MB |
50 ~ 100 MB |
0 ~ 50 MB |
| Memory\Pages/sec |
0 ~ 900 |
900 ~ 1000 |
1000 ~ 8 |
| Memory\Pool Paged Bytes |
0 ~ 200 MB |
200 ~ 220 MB |
220 ~ 8 |
| Memory\Pool Nonpaged Bytes |
0 ~ 100 MB |
100 ~ 110 MB |
110 ~ 8 |
| Memory\Free System Page Table Entries |
8000 ~ 8 |
5000 ~ 8000 |
0 ~ 5000 |
| LogicalDisk(_Total)\%Free Space |
15 ~ 100% |
10 ~ 15% |
0 ~ 10% |
Alarms are fired whenever the monitored data reaches Attention or Critical; when this happens, an email with the report of the underperforming computer is sent automatically SendMail driver.
The perfmon.lib library comprises an XObject (MonitorData) and three XControls (CMDMonitor, FullMonitor, and CondMonitor), which are described next:
MonitorData
Inside this XObject, you will need to set up both drivers: SendMail must be set up with the email server used for sending messages, and ESysInfo with a user account that works as an administrator of the computers being monitored (Figure 1). Additionally, you need to check if both drivers’ DriverLocation property is correctly set up.
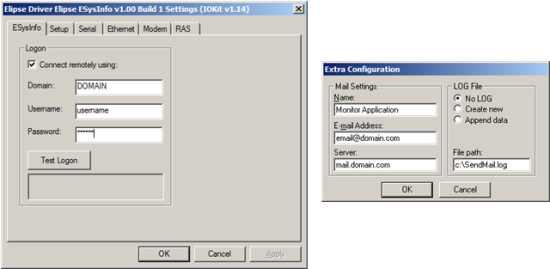
Figure 1: Setting up Elipse SysInfo and SendMail drivers
When creating an object instance, the properties to be inserted manually are: ComputerName, with the name of the machine to be monitored (ex: \\MACHINE), and Owner, with the email of the responsible for the machine – address where the alert email will be sent to. The other properties are filled out automatically via drivers.
CMDMonitorData
This XControl changes a MonitorData‘s default properties at runtime, as a configuration window (Figure 2). Its only property (Source) receives a MonitorData type object.
The Destination Address field receives the email addresses set up to receive this object’s alerts; you can insert more than one by using a semicolon between addresses. The Attention and Critical columns display the default values seen previously (table), but they can be edited with this control. The checkbox to the left disarms that alarm.
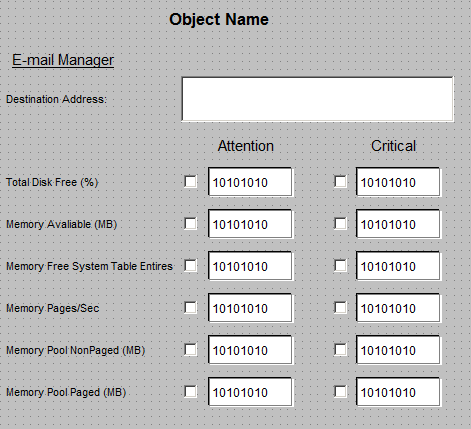
Figure 2: XControl CMDMonitorData
FullMonitor
This XControl contains information on the performance of the machine specified at MonitorData. If any value is on Attention range, the display’s background color turns to yellow; if Critical, it turns to red.
This control’s properties are: Source, which receives a MonitorData type object; SettingScreen, which receives a screen with a CMDMonitor type control; and ShowInfo (Boolean), which indicates if the control will be displayed in full (Figure 3) or reduced format, with only the column to the left visible.
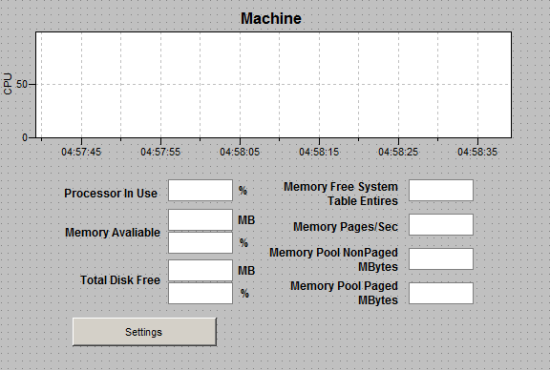
Figure 3: XControl FullMonitor
CondMonitor
This XControl is very simple: it only indicates the general status of the monitored machine (Figure 4). The Condition display has four possible values, with their respective background colors:
| Text | Color | Description |
| Fail | Gray | No communication between driver and monitored computer. |
| Normal | Green | No alarms have been fired; ideal conditions. |
| Attention | Yellow | A LO alarm has been fired. |
| Critical | Red | A LOLO alarm has been fired. |
There are two properties: Source, which is MonitorData type, and DetailScreen, which is the name of a modal screen that will open when the control is clicked. This property is used for showing a window with extra information via a FullMonitor type control, for example.
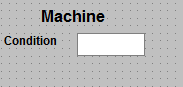
Figure 4: XObject CondMonitor
Attachments:
