Many times, a chart report must be exported automatically, with no intervention from the operator. Therefore, the Report’s Chart object must be set up so that data is moved correctly, since E3Chart’s CopyConfig method won’t be used.
To do so, follow these guidelines:
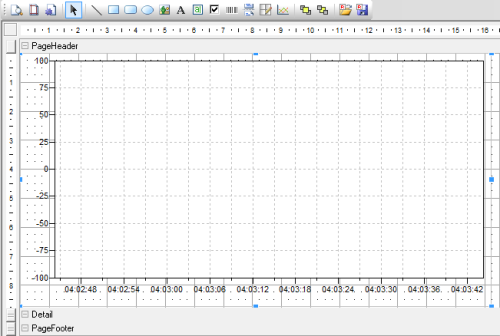
1. Create a Report and insert an E3Chart in its PageHeader section.
2. Then, access the properties of the newly created E3Chart and set up the Query to be used by historic pens. If you need to filter the Query, this is where it needs to be set up.
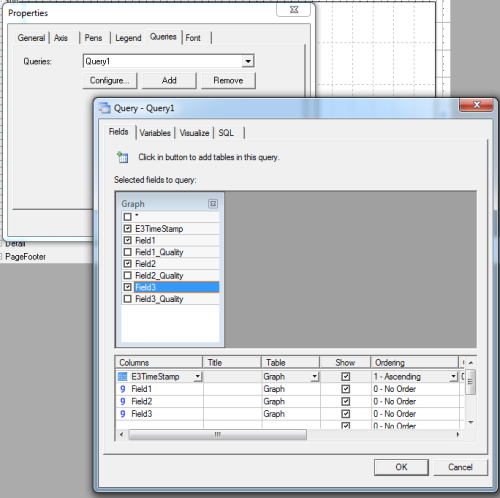
NOTE: Make sure you’re setting up the E3Chart’s Query, and not the report’s.
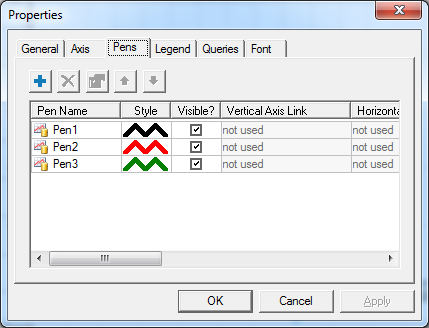
3. Once the Query is done, create and set up historic pens for each of the selected fields.
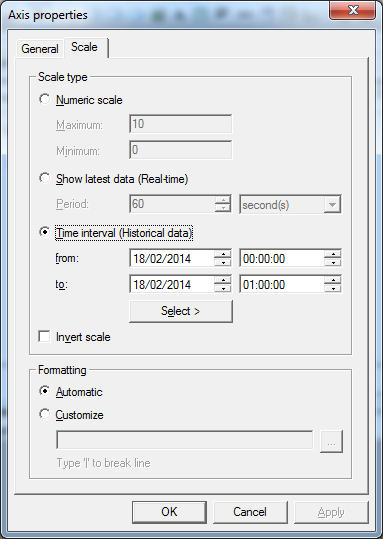
4. Finally, set up the horizontal axis scale to display a historic, to-be-defined time interval inside the application.
5. Once the Chart is set up, open the scripts editor, select PageHeader object and OnBeforePrint event. In this event, set up the previously inserted E3Chart’s Query filter, run the Querry, load the result, and organize it on screen.
Example:
Sub OnBeforePrint

Set Chart = Report.Sections("PageHeader").Controls("E3Chart1") 'Stores E3Chart's path at Chart variable's screen
Set Query = Chart.Queries.Item("Query1") 'Stores E3Chart's Query's path at Query variable
Query.SetVariableValue "InitialDate", Application.GetObject("Data. IniDate").Value 'Sets filter's InitialDate variable's value
Query.SetVariableValue "FinalDate", Application.GetObject("Data.EndDate").Value 'Sets filter's FinalDate variable's value
Query.Execute() 'Executes the query with the filter
Chart.LoadData() 'Loads query result inside the Chart
Chart.FitAll() 'Fits data in the axes
Chart.HorScaleBegin = Application.GetObject("Data.IniDate").Value 'Sets the horizontal axis' initial date
Chart.HorScaleEnd = Application.GetObject("Data.EndDate").Value 'Sets the horizontal axis final date
EndSub
6. Finally, create a Timer tag whose functions are filling the initial and final dates and run the Report’s Export command.
Sub Export_OnPreset()
Parent.Item("IniDate").Value = now-1/24/60   'Current time minus one minute
Parent.Item("EndDate").Value = now           'Current time
Set report = Application.LoadReport("[Report1]")
Report.Export "PDF", "C:\GraphReport.pdf"
End Sub
NOTE: Attached to this article is a demo application developed with Elipse E3 version 4.5 build 238.
Attachments:
