Question:
How can I set up a query per date in an E3Chart plotting historical data, and then set up the horizontal axis to automatically show the selected/queried time interval?
Solution:
Among E3Chart’s properties, two of them are of great importance when you need to change the period in the grid’s main horizontal axis:
HorScaleBegin property: determines the initial value applied to the grid’s main horizontal axis. This value can be a numeric one for XY E3Charts, or a Data one for E3Charts with a fixed time scale.
HorScaleEnd property: determines the final value applied to the grid’s main horizontal axis. These properties must be attributed with the right values to adjust the horizontal axis.
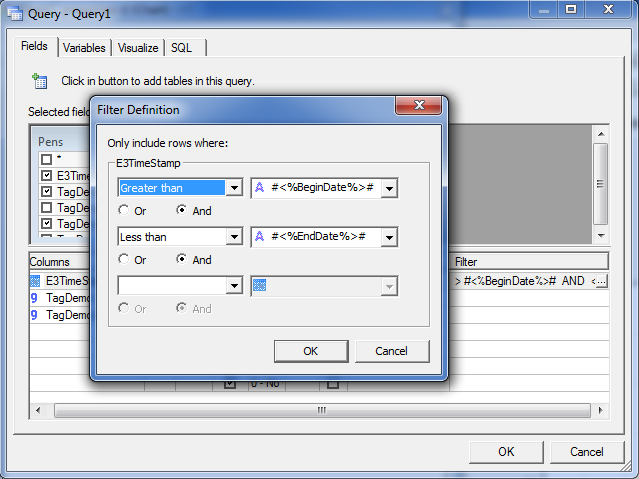
In addition to defining the time interval in the horizontal axis, you must query the database to search for the saved information and the chosen period. Considering the E3Chart is set up to query the database and that the desired pens have already been created, the next step is to insert a filter in this query’s E3TimeStamp field, then only the desired period will be displayed. The figure below illustrates how to include this filter.
Example:
The settings for the E3Chart are now ready; next, you will have to configure how to pass the values of the initial and final dates to E3Chart’s query. One way to it is by inserting two SetPoints onto a screen, the first one for the initial date and the second one for the final date, which will capture the period requested by the user; also onto the same screen, insert a Button that will pass (via scripts) these values to E3Chart and its query. You can use the following script:
Example:
Sub CommandButton1_Click()
‘ Instantiates initialdate and finaldate by loading values from the SetPoints with the chosen dates
initialdate=Screen.Item(“Text1”).Value
finaldate=Screen.Item(“Text2”).Value
Set E3Chart1 = Screen.Item(“E3Chart1”)
‘ Sets the horizontal axis scale via HorScaleBegin and HorScaleEnd properties
E3Chart1.HorScaleBegin = initialdate
E3Chart1.HorScaleEnd = finaldate
‘ Sends values to initialdate and finaldate variables created at E3Chart’s query’s filter
Screen.Item(“E3Chart1”).Item(“Query1”).SetVariableValue “initialdate”, initialdate
Screen.Item(“E3Chart1”).Item(“Query1”).SetVariableValue “finaldate”, finaldate
‘ Updates the query at E3Chart
Screen.Item(“E3Chart1”).Queries.UpdateData()
End Sub
Attachments:
