Question:
Can a pen’s minimum and maximum values be displayed in an E3Chart?
Solution:
Yes. To do so, access the pen’s settings, on Statistical Data tab, and check the Show minimum and maximum option.
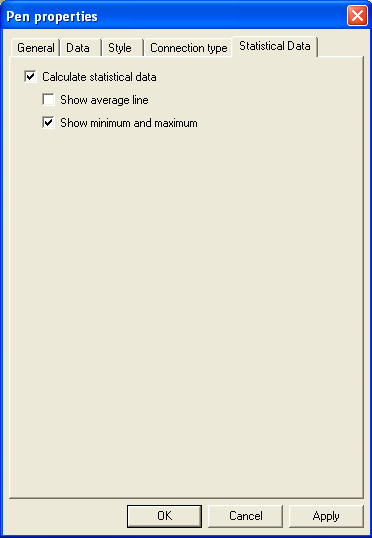
To view these values, just enable the MinimumY and MaximumY columns.
NOTE: The attached demo application was developed with Elipse E3 v. 3.5 build 356.
Attachments:
