Question:
Can I add visual reference elements (like lines and bands) to the Axis properties in an E3Chart?
Solution:
Yes. The E3Chart object is an ActiveX component developed exclusively for working with Elipse E3. With it, you will be able to display charts whose Tags will not only vary in real time, but also record historic data in a database. Generally speaking, each data sequence is represented in E3Chart via Pens. Each Pen then has a specific set of data associated to it, which can be Tags of Query fields. You can also create several different Axes, and associate the data in the Pens to different scales.
Since Elipse E3 version 4.8.239, there have been two new visual reference elements in E3Chart. They are: Normal Band and Reference Line. These new features help visualizing data in the Axis. To use this resource, first you will need to access the Visual Reference tab from E3Chart’s axis properties, as seen below.
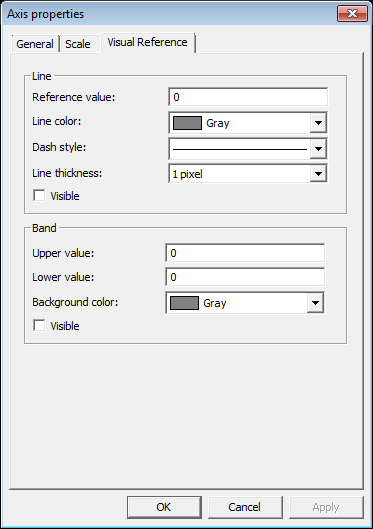
Reference Line
The value of a Reference Line refers to either the x or y axis, depending on the type of scale (vertical or horizontal). This options corresponds to the ReferenceLineValue property, as seen below.

Reference Band
The Reference Band, on the other hand, will stand for a range of values that comprises a filled up area, where you can insert both a lower and a higher value. These options correspond to NormalBandLowValue and NormalBandHighValue properties, as seen below.

Both the line and band are always placed below the plotted curve, as seen below.

