1) Introduction
The task of monitoring the current state of computers on a network using Elipse E3 so far was not as simple as it appears to be. Being aware of this need, Elipse Software has developed SysInfo driver, which can check several operational system information in real time and processes running in each computer. Besides the driver, Elipse has created a library to handle important data checking about a computer performance, with alarms and configurable warnings.
2) The Elipse SysInfo driver
The Elipse SysInfo driver fetches its data from Performance Monitor, which is a snap-in of Microsoft Management Console (MMC). Information reading is done by way of counters provided by the operational system and also by programs being executed on each computer. This way, the available counters may vary according to the installed system and softwares.
There are several counters that are common among Windows versions, for example information about processor resources, memory and hard drive. Based on this data, a library was created to monitor and analyze computers on a network. For more information, check Elipse SysInfo driver manual [3].
3) The perfmon.lib library
The perfmon.lib library [1] is responsible for showing basic computer information to the user in order to keep it working: processor, memory and hard drive. As a standard, it was adopted that the monitored components have four states: Failure (communication has failed), Normal, Attention and Critical.
The value range for each state is configurable using an XControl (CMDMonitorData), which will be detailed further. Standard defined values may be seen on table 1. These values definition was based on an article published by Microsoft [2].
|
COUNTER |
NORMAL |
ATTENTION |
CRITICAL |
|
Memory\Available Mbytes (MB) |
100 ~ 8 MB |
50 ~ 100 MB |
0 ~ 50 MB |
|
Memory\Pages/sec |
0 ~ 900 |
900 ~1000 |
1000 ~ 8 |
|
Memory\Pool Paged Bytes |
0 ~ 200 MB |
200 ~ 220 MB |
220 ~ 8 |
|
Memory\Pool Nonpaged Bytes |
0 ~ 100 MB |
100 ~ 110 MB |
110 ~ 8 |
|
Memory\Free System Page Table Entries |
8000 ~ 8 |
5000 ~ 8000 |
0 ~ 5000 |
|
LogicalDisk(_Total)\%Free Space |
15 ~ 100% |
10 ~ 15 % |
0 ~ 10% |
Table 1: Counters analyzed and default value range
By using alarms, which are launched as soon as some monitored data hits the alert or critical state, an email is automatically sent with a report on the computer that presented the resources under expectation, one report by computer with problems. For sending email the SendMail driver was used [4].
The perfmon.lib library is made of one XObject (MonitorData) and three XControls (CMDMonitor, FullMonitor e CondMonitor), which will be described next:
MonitorData
Inside this XObject, the first step is to configure both drivers: SendMail with an email server that will be used to send messages and ESysInfo with a user account that is an administrator of the computers being monitored (figure 1). Besides, you must confirm that the DriverLocation property of both drivers is correct.
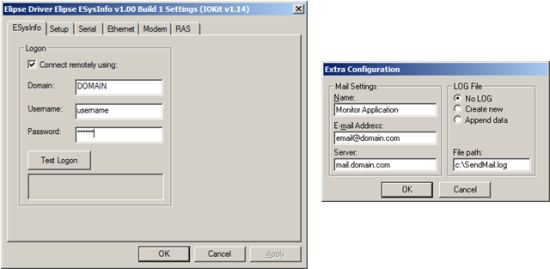
Figure 1: Elipse SysInfo and SendMail driver’s settings
When creating an instance of the object, the properties that should be manually inserted are: ComputerName, with the name of the machine that will be monitored (e.g.: \\MACHINE), and Owner, with the email of the machine owner – address to which the alert email will be sent. The other properties are filled in automatically by the drivers.
CMDMonitorData
This XControl is used to change standard properties of a MonitorData at runtime, with a settings window (figure 2). Its only property – Source – should receive an object of type MonitorData.
The Destination Address field gets all email addresses configured to receive alerts from this object, and more than one address can be inserted, each one separated by semicolons. The Attention and Critical columns have the standard values cited previously (table 1) but they might be changed using this control. The checkbox on the left disables that alarm.
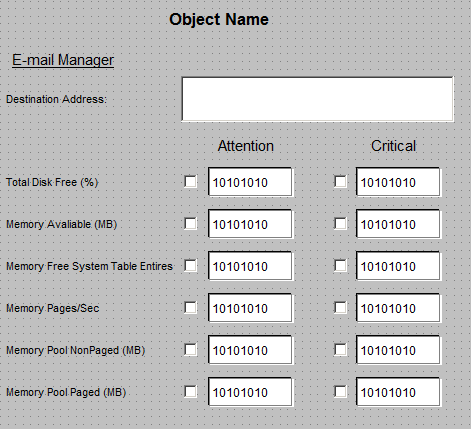
Figure 2: XControl CMDMonitorData
FullMonitor
This XControl has information about the performance of the machine specified on the MonitorData object. In case some of the values are outside the Attention range, the display background color will become yellow; when in Critical, it will be changed to red.
These control properties are: Source, which must receive an object of type MonitorData; SettingScreen, which must receive a screen object that has a control of type CMDMonitor; ShowInfo, of boolean type, that indicates if the control will be fully displayed (figure 3) or in a short form, only with a left column visible.
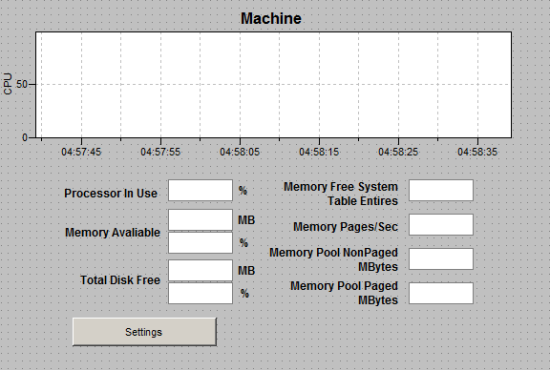
Figure 3: XControl FullMonitor
CondMonitor
This XControl is really simple; it only indicates the general state of the monitored machine (figure 4). The Condition display has four possible values with their respective background color:
|
TEXT |
COLOR |
DESCRIPTION |
|
Failure |
Gray |
There is no communication between the driver and the monitored computer. |
|
Normal |
Green |
No alarm type was launched, ideal conditions. |
|
Attention |
Yellow |
Some LO alarm type was launched. |
|
Critical |
Red |
Some LOLO alarm was launched. |
There are two properties: Source, of type MonitorData, and DetailScreen, which is the name of the modal type screen which will be opened when clicking on the control. It is used to display a window with more information, and a control of type FullMonitor may be placed on it, for example.

Figure 4: XObject CondMonitor
4) Conclusion
Monitoring computers using perfmon.lib library and Elipse SysInfo driver is a very simple task, being needed, basically, to define the computers to be monitored and the range of values considered ideal in each computer.
Attachments:
ESysInfo.zip
Sendmail.zip
E3Project.zip
