KB-29843: Displaying variables with different scales on the same chart.

Question:

How can I display variables with different scales in the same E3Chart?

Solution:

In E3Studio, create an axis for each scale and select the respective axis in each pen’s settings.

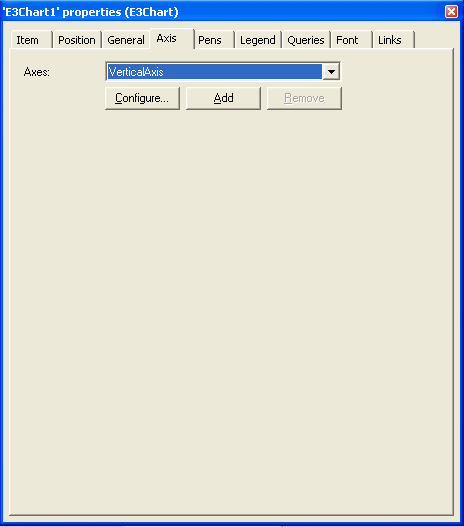
To create a new axis, you must open the E3Chart‘s properties window and click the Add button on the Axis tab.

Print Friendly, PDF & Email

Este artigo foi útil? Was this helpful?

Classificação média - Average rating 0 / 5. Count: 0

Deixe seu Comentário

Seu endereço de e-mail não será publicado. Campos marcados com asterisco são obrigatórios *