Question:
How can I display the pen’s values being displayed on the E3Chart?
Solution:
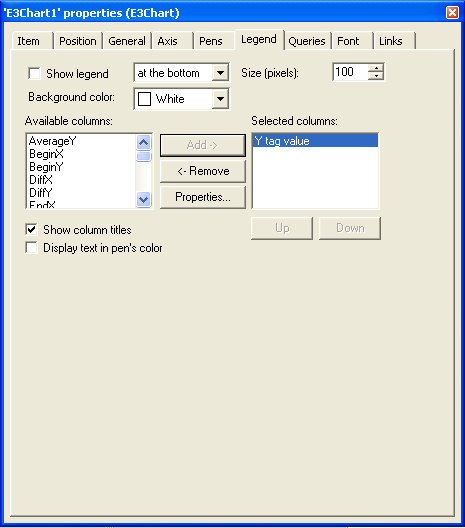
To do so, go to Legend tab in E3Chart‘s properties and enable the legend, selecting the fields you want to display.
NOTE: The legend is used to display the chart’s visible pens. When selected via mouse click, it displays data on the pens, such as color, name, status, etc. The full description of all available options for identifying columns is in the user’s manual.
