INTRODUCTION
The RMChart ActiveX can be used in E3 for graphic visualization of data. In addition, this is the ideal tool for presenting statistical information, since they are loaded into the database and do not need to be displayed in real time.
RMCDesigner
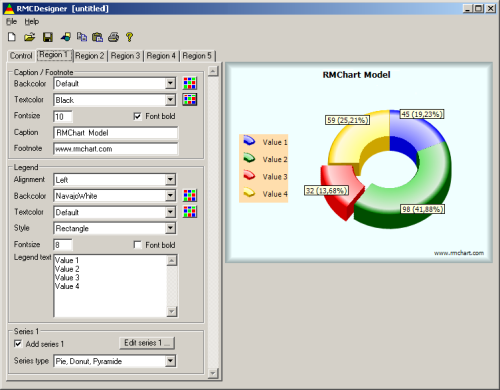
The RMCDesigner is a program that helps create and develop a template file (with .rmc extension) containing the chart’s initial settings. Although you can create this structure entirely via scripts, RMCDesigner has a friendlier graphical interface, which facilitates your work and provides instant preview of the effects applied.
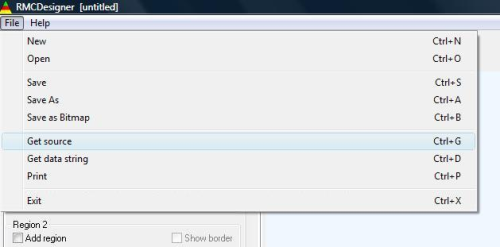
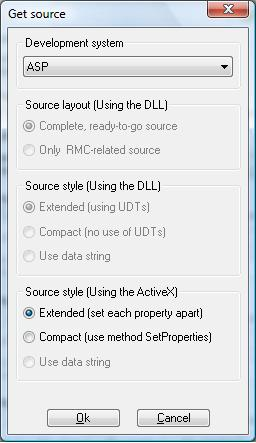
After clicking Ok, the code is copied to the Clipboard.
Integrating RMChart into E3
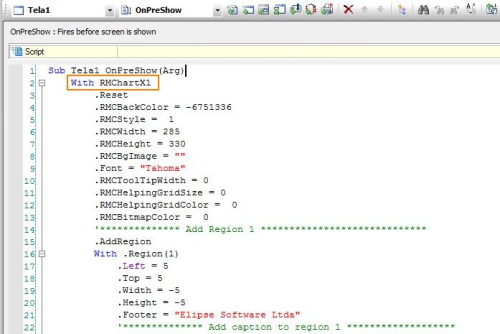
In E3, insert an RMChart object onto a screen by right-clicking it and selecting Insert – RMChartX. In the screen’s OnPreShow event, create a Script pick and paste the code obtained in RMCDesigner. In the figure below, the code previously generated is shown with its configured properties. As you can see, With command requires RMChartX1 variable to contain an RMChart object.
set RMChartX1 = Item (“RMChartX1”)
RMChartX1.Clear ()
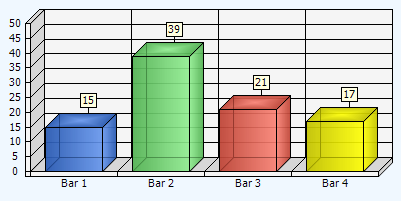
Loading data into the ActiveX At RMChart, each series (data set) displays the Datastring property, which contains the values to be drawn. This property requires that the values be separated by asterisks (“15*39*21*17”). So, when you have a bar chart, each value represents a bar. Following our example above, we would have:
SELECT Area, Count (ConditionActive) the TotalActiveAlarms
FROM Alarms
WHERE ConditionActive = 1
GROUP BY Area
| Area | TotalActiveAlarms |
| TankArea1 | 590 |
| TankArea2 | 630 |
| TankArea3 | 740 |
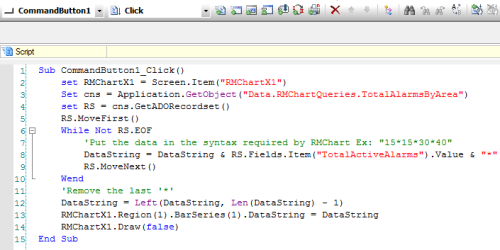
As seen in the figure, you must create a variable that receives the RMChart object (in this example, RMChartX1) and execute the query previously mentioned by using GetADORecordset() method.Thus, the query’s result will be handled via scripts.
A While loop will run until the last record of the Recordset, concatenating the values returned according to the syntax of RMChart’s DataString property (590*630*740).Finally, Draw() method will perform the graphic design.
Final Remarks
Once you set the template and extract the code via RMCDesigner, the remaining task will belong entirely to E3, which will create and set queries, and then manipulate their results via Recordset. Thus, the data string will be set up, and then passed to the RMChart object.
The RMChart is a great tool for viewing statistical or historical charts. With its aid tool for building the template, your work becomes easier and the application becomes more attractive to the user.
Notes:
- The RMCDesigner is not installed alongside E3.This software program and its components can be found for download on the Internet.
- Attached, sample application using RMChart developed with E3 3.2 build 248.
