1) Introduction
E3 supports the creation of scripts in VBScript language, with almost all resources available for this language. There is an extensive documentation for VBScript available in many different sources, such as books, websites, forums, etc., in addition to the one that comes along with E3.
However, there are some small restrictions when implementing VBScript for E3. Two of them are:
- You cannot create user functions. This means that if a user needs to execute a certain function in more than one situation (such as updating the status of a database table, for example), this function must be linked to an event that is supported by E3 (for example, tag variation).
- E3 variables have no defined type. This can be seen when you use DIM command to declare a variable, for example. The type of variable must be adjusted in the script: this means that an integer-type variable can receive a string, without indicating error and without restricting the received value. These resolutions are made via code.
Despite of these features, you can create any solution needed by a given object or process with E3 scripts. This task may sometimes become arduous, due to the complexity frequently found when coding a script. To work around this situation, there is an interesting alternative for debugging scripts in E3: using text files, where each variable’s value is printed. This works basically as a log; its downside is that it demands that the commands needed by these value’s writes be inserted in the script code. After the script has been debugged, you will still have to “clean” the code to avoid using unnecessary resources from the server.
To eliminate these requirements, this article presents a very versatile and powerful debugger, which is supplied free of charge by Microsoft. This software is available either at Windows Installation CD or at Microsoft’s website.
2) MS JITDebug
Once JIT has been installed, you will need to enable it via Windows registry. It can be disabled later, and we recommend you keep the debugger enable only during the period you are working with it, since any type of script error (in either E3 or other software) will only cause the window for opening the debugger to be opened. This will happen, for example, if you browse Internet pages containing errors.
To enable Just-in-time Debugger, just access REGEDIT and set up “HKEY_CURRENT_USER\Software\Microsoft\Windows Script\Settings\JITDebug” with value 1. To disable it, set up its value as 0.
3) Debugging scripts in E3
In order to use JIT, we need to create a simple project, with two tags and a few scripts. Figure 1 shows how the Organizer looks like when all items are inserted.
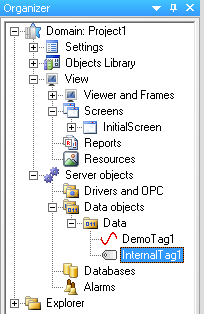
Figure 1: Organizer with all data inserted
InitialScreen must be set up as seen in Figure 2. It will be a very simple screen, with a text, a display, and a blue rectangle. The display must show item “DemoTag1.Value”.
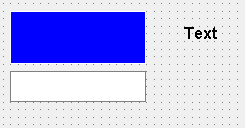
Figure 2: InitialScreen to be developed
After the screen has been designed, create the script shown in Figure 3. The script starts with a “stop” command, which causes its execution to be interrupted and JITDebug to be opened: this is the first way you can open the debugger via E3. The debugger will also be opened whenever there are errors in any script at E3.
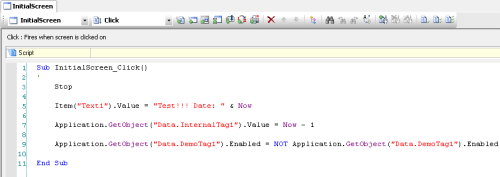
Figure 3: Script to be debugged
After InitialScreen’s script has been set up, create the script seen on Figure 4 at the rectangle1s OnClick event.
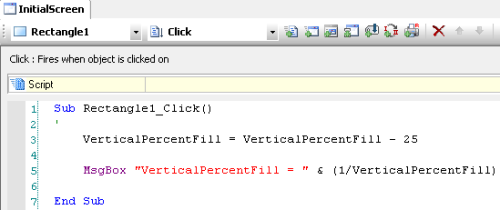
Figure 4: Script of rectangle’s Click event
Notice that the script does not handle a serious error (division by zero) when VerticalPercentFill property’s value is reset. As you can see, every time an error is detected by the debugger but is not handled in the script, the debugger is automatically opened to show where the error is.
4) MS JITDebug in action
After the project has been set up, you will need to run it. When you open E3 Viewer, click the screen’s free area. The debugger will open, and a script will be displayed with one of its lines in yellow (script’s current execution point). Figure 5 shows you what must be displayed at that time.
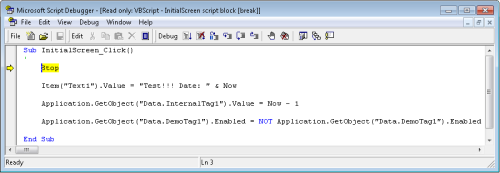
Figure 5: Debugging InitialScreen’s OnClick event script
JIT Debug’s most important tool is the Command Window, which allows:
- Visualizing the values of E3 variables.
- Executing VBScript’s command, as well as retrieving their return values.
- Changing E3 data values, in order to study E3’s behavior with these new values.
Figure 6 shows some commands that can be executed at the Command Window. In this figure, it has been requested that the script returned the current time (? NOW) and that a “Test” message were displayed on screen.
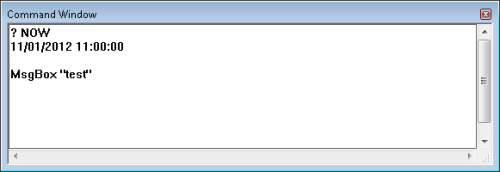
Figure 6: Command Window executing VBScript’s functions
To check E3’s variables values, you must:
- always start the question with a question mark (?).
- write the variable’s path. For example: Application.GetObject(“Tag”).Value.
- make sure the variable had been initialized correctly.
5) Exercises with the debugger
To guarantee the initial conditions will be the same as the ones described here, you must first stop the application. Next, you must execute the project again, and then follow the procedures described below.
- Click the InitialScreen, and then the debugger will open. Notice that before that, the display was showing different values for DemoTag1, generated automatically. When opening the debugger, this update will no longer take place, because the server will be closed, waiting for the debugging process.
- Before executing any action in the debugger, open the Command Window. On it, execute the command “? Screen.Item(“Texto1″).value”. The value returned must be “Text to be modified“.
- Return to the debugger and execute a command, by pressing F8 key. Execute the previous command again. The return message will be similar to “TEST!!! Date: 8/3/2004 14:03:55”, where the displayed message is the test’s execution date.
- Execute then the command “? Application.GetObject(“Data. InternalTag1″).Value”. The returned value must be 0. Return to the debugger and execute another step of the procedure (corresponding to InternalTag1). Next, execute the command at the Command Window. The expected result is the date previous to the test (now – 1).
- Finally, execute the command “? Application.GetObject(“Data. DemoTag1″).Enabled”, whose return value is TRUE. Execute the last command at the script window and run again the request for Enabled property at the Command Window. Notice that, as expected, the property’s value is now FALSE.
- Close the debugger and check whether DemoTag1‘s value is not fluctuating, because it is disabled. To enable it, just execute InitialScreen‘s OnClick script again. The debugger is opened one more time, at stop command, as expected. To avoid having to repeat all steps in the script again, place a breakpoint on the script’s last command line. To reach this line, press Step Out option on Debug menu. The script will be executed until a breakpoint is found. Finish debugging this script and notice the value of DemoTag1 being updated automatically.
- Close the debugger, but keep E3 Viewer open. Then, click the rectangle (a message is displayed with the inverse value of VerticalPercentFill property), and then repeat this operation until the debugger is called automatically.
- When this happens, execute the command “? VerticalPercentFill” at the Command Window. Notice that the value is zero, which will cause an error. To avoid this, change the value of VerticalPercentFill property’s value to 1 by using command “VerticalPercentFill = 1” at the Command Window. Finalize the script’s execution, and notice that the message to be displayed does not concern division errors, but the result of the inversion (1/VerticalPercentFill), as in the previous cases.
- This exercise has shown you how to eliminate script errors via debugger settings. Such settings are not definitive, and must be inserted on the code only when necessary.
6) Final Remarks
In case of erratic behavior, or even of unexpected results in scripts, you must always rely on debugging tools to detect and eliminate such anomalies in the shortest possible time. This article illustrates the usage of a debugger that belongs to Windows, and which can be installed in any machine with no costs for the developer.
Should there be any problems or difficulties executing this project, please contact Elipse Software’s technical support.
